Visualizing your AAARRP priorities as a way to manage up in your DevRel team
In this article, I'm describing how we used the AAARRRP framework to visually describe our DevRel team's strategy and clarify the reason for our day to day activities to our internal stakeholders, and more focus on impact instead.

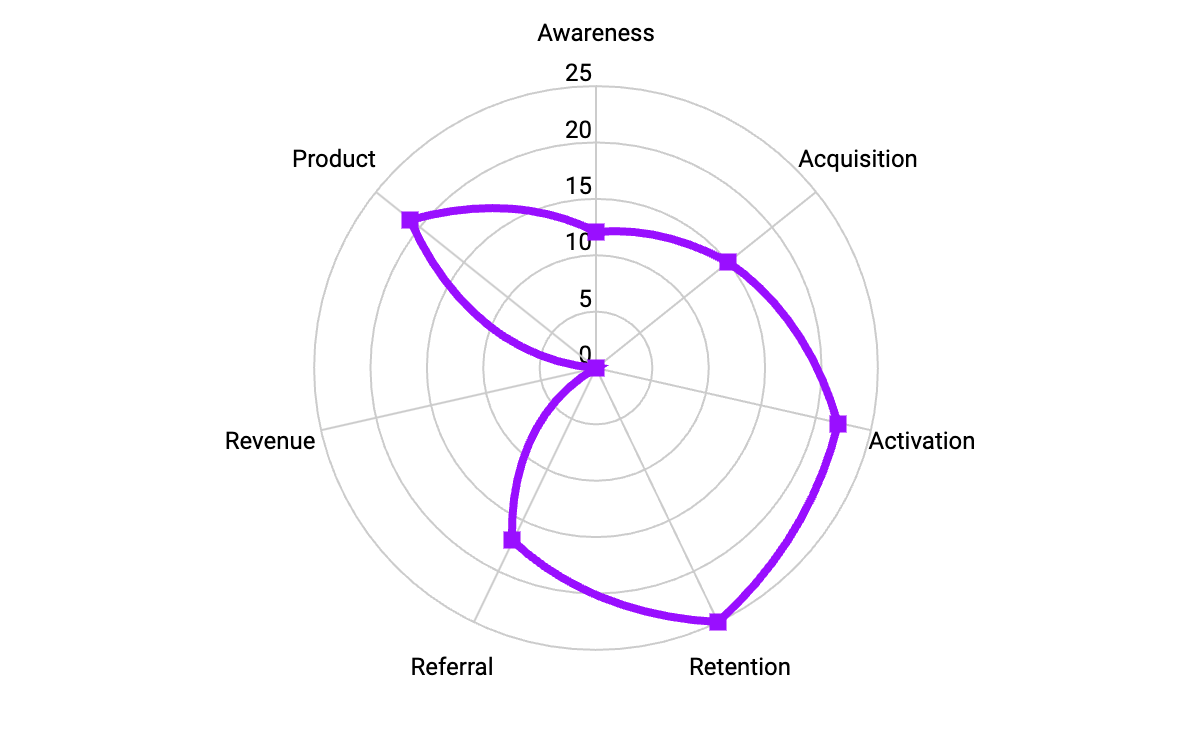
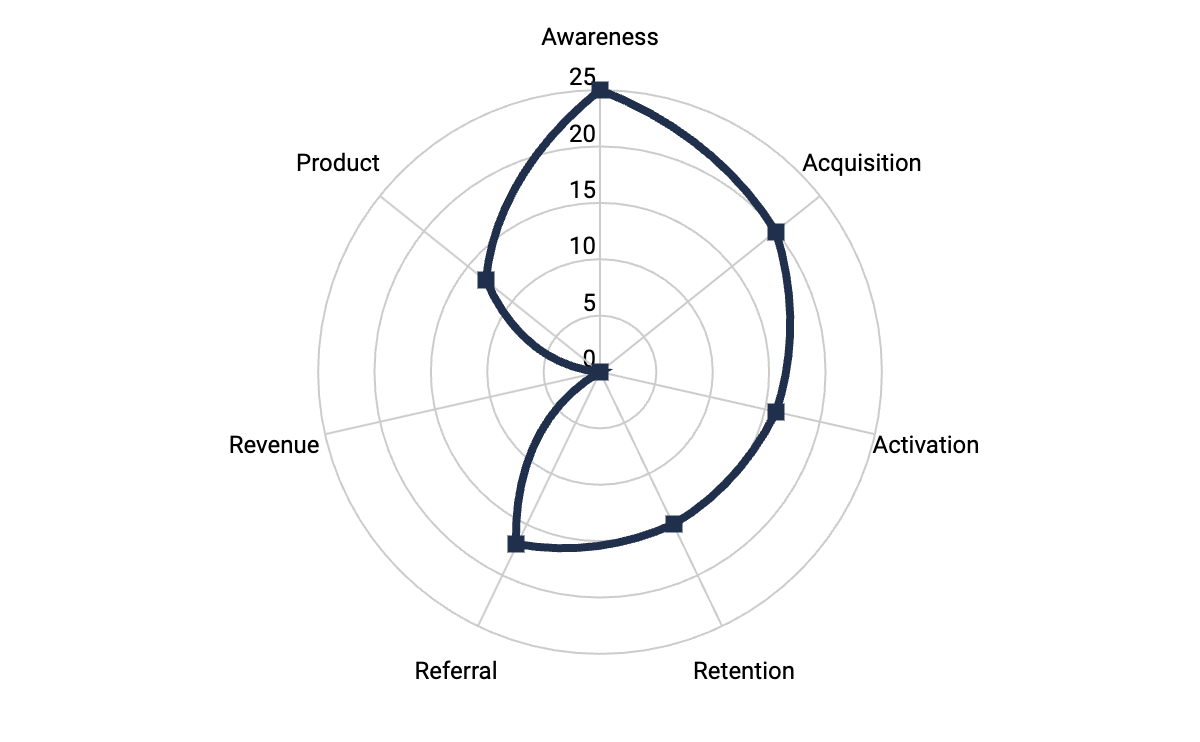
TL;DR : we have been using the AAARRRP framework as a visual and easy way to align with stakeholders which types of activities are the most relevant for our customers. It can look like this

Let's dive into it!
Some context
Even though I have been doing Developer Relations for a few years unofficially or semi-officially, it was only two years ago that I got my first official role as a Developer Advocate. And after just a few months, I was offered to lead the team. We're a small team of three (me included) and our team falls under engineering.
It was never really an issue for us to create a strategy on what to achieve, or how to achieve it. We focussed on our 3 pillars: Code, Content and Community and selected the most relevant activities.
For example, being a B2B company we knew that running the conference circuit wasn't the most efficient way to create value, for the simple reason that people wouldn't be able to sign up for our services. We quickly decided instead to embed ourselves close to documentation and provide many samples for the companies who were using us, bringing a lot of internal feedback at the same time.
But even though we had no doubt about our priorities, it wasn't always as clear for higher management, nor other stakeholders. After all, Developer Relations was a relatively new thing inside the company and only a few people had direct experience with the domain in the past. And we all know that even for companies seasoned with DevRel, measuring impact and making sure activities align are a difficult topic.
We received a lot of challenging questions over time regarding our priorities :
- We see that the insert competitor DevRel team is very present on Youtube. How is it that your are not doing the same?
- How is it that your Twitter account gets very few likes compared to insert other company.
- Why do we not see many community contributions on your GitHub account, compared to insert large company?
- Would you please join us at the booths for insert conference, we want to increase hiring.
All those questions are very fair, and they deserve clear answers. Thing is, they were quite obvious for us given the context we had and it was a struggle for me to communicate those answers at scale and in a strategic way (understand : Find a way that people understand those answers, and hopefully give enough context that they come to the same decisions by themselves).
It's after reading about the AAARRRP framework that a potential solution came to mind 😊.
Quick sideline about priorities / activities
My point with this method is to focus on how to communicate in a scalable way the type of activity we plan on focussing on, not the exact activity performed.
For example, we might want people to understand that writing code samples is the most impactful activity we can do.
However, we will not use it to communicate which code sample to write. For this, we might instead use a combination of data sources like documentation statistics, or support tickets for example. I may write more about this later in another article.
A quick intro about the AAARRRP framework
I'm not going to expand myself much about this, because I would be ripping off the original article. I recommend you to go read it instead if you have never heard of it before.
Here is the very minimal version. As Developer Relations team, we can operate on several key moments of the customer journey :

Depending on the type of company we're working on and the strategic priorities of that company, some of those parts will be more crucial than others.
Early on, many SAAS products want to focus on awareness and acquisition to drive as many new customers in as possible, and grow fast (The famous MAD) .
As your product grows in maturity, you may want to increase the "stickiness" of your product and increase retention, or work on activation of additional features for your existing customer base.
Typical DevRel activities that we carry have impact of different parts of that funnel (usually several at the same time).

Note: The original post also adds weight to the equation in order to select activities. We will not here, for simplicity's sake. The whole idea stays valid here.
From AAARRRP to strategic communication
Note: All those charts have been altered and do not contain internal information 😊
So far, nothing new under the sun. That's where we'll go just one step further and use the content above for strategic communication.
Let's say that based on the current context, we decide to focus on activation, retention and product.
- We can draw this as a chart to help communication with stakeholders.
- We can also draw (rough, given we do not have internal knowledge) equivalent charts for other companies in the space for comparison.
- We can even draw our own chart year on year, to show how our activities vary as priorities shift, or impact decreased (law of diminishing returns).
- Now for the key part : We use these charts to validate assumptions with stakeholders, who will be able to derive the corresponding activities themselves.
For example, given the decision above we can draw this:

With those priorities agreed, the common understanding is that we should focus on activities like Code Samples, Guides, Tutorials, and answering Stack Overflow questions.
Again, we can more easily explain why we have a lesser focus on social media and the conference circuit that others by comparing main focuses between entities.

Once the shape of our strategy is agreed to, the type of activities expected become clearer for everyone and we can focus on the impact of those activities. And if the priorities change, it's always time to come back to the drawing board 🎉.
Let's imagine now that our company's internal focus heavily shifts towards "closing deals" because we need to extend our runway. It might be time for the DevRel team to start acting on the Revenue part of the funnel, reduce Product efforts and do Pre-Sales activities. We can update the plan, propose a new shape and double check with stakeholders that the change fits the new landscape :

Of course, whether the type of activities to be carried on fits DevRel well, is sustainable long term and more is another discussion altogether. The main point here is to make your priorities clear and communicate them accordingly.
About the scale of priorities
One question you might wonder is : How do you calculate the scale of each priority in your bar chart?
Well, so far our method isn't very scientific 😊. We mostly want to show relative priorities of activities and as such we're using a set number of points and sharing them across the different axes of the chart. For example, pick 70 points (10 per angle) and subdivide. The chart then helps us make decisions quarter to quarter or day to day. Of course, when drawing other team's chart, all numbers are best effort and based on impressions.
As we use these graphs more, we're experimenting with other ways to measure that could be more relevant. For example incorporating alignment and relevant weights that the original AAARRRP article mentions.
A word of conclusion
Overall, the only thing we've been doing is taking the AAARRRP framework as an inspiration to clearly visualise what our team focusses on and bring some clarity internally. We've been using it on all of our presentations and internal pages focussing on our team's strategy.
It has helped to focus discussions with stakeholders more on how much impact we can bring, rather than what activities to carry and why and it's really been useful for us.
Having joined DevRelCon this year I know that internal communication is always a strong topic in DevRel teams. Maybe this can help bring some clarity on the topic!
Cheers, and talk soon.
Julien